

In the data analysis world, there are plenty of opportunities to learn about different technologies. In that context, I tried to explore Google Data Studio, I am capturing my learning steps.
History:
Google Data Studio was initially made available to users in 2016. The development of the platform is a great example of rapid, Agile development.
Feature:
Google Data Studio has some important capabilities like Data Visualization, Data Access, Data Processing, Communication, and Data Exploration and Analysis.
Data Set:
To start with our own data analysis project, it is the best option to take the data from Kaggle. Here is the data link https://www.kaggle.com/gregorut/videogamesales
Abstraction:
This data is about Video Game Sales data.
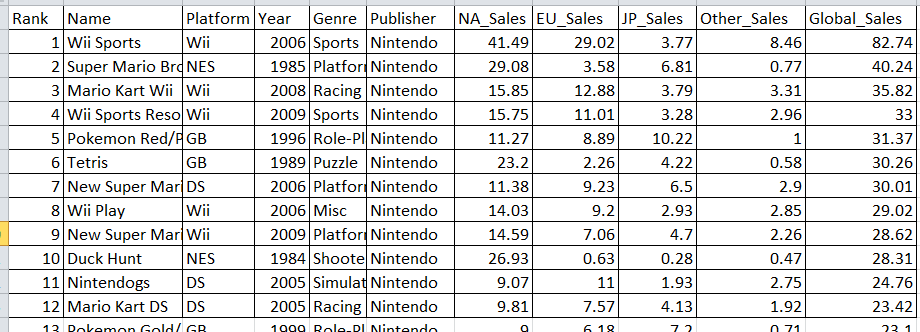
The file includes the following fields.
•Rank — Ranking of overall sales
•Name — The games name
•Platform — Platform of the game’s release (i.e. PC, PS4, etc.)
•Year — Year of the game’s release
•Genre — Genre of the game
•Publisher — Publisher of the game
•NA_Sales — Sales in North America (in millions)
•EU_Sales — Sales in Europe (in millions)
•JP_Sales — Sales in Japan (in millions)
•Other_Sales — Sales in the rest of the world (in millions)
•Global_Sales — Total worldwide sales.
Start with Google Data Studio:
If we do not have Google Account, the below screen will be displayed
If we have Google Account, the below screen will appear.
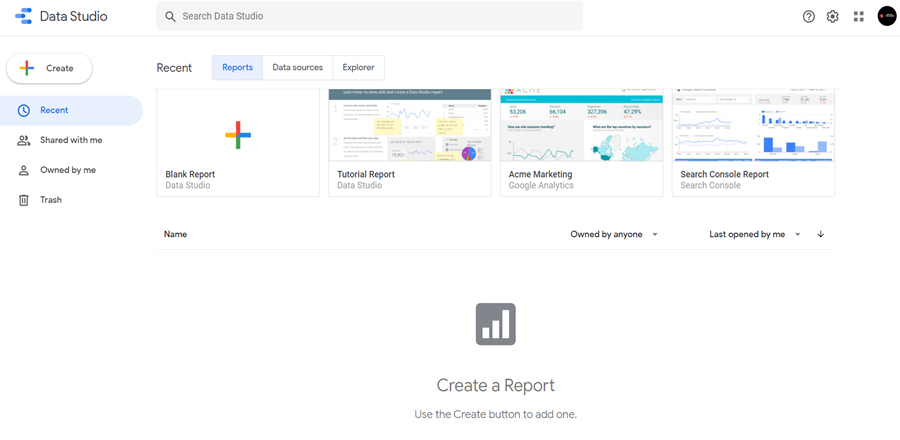
Features of Landing Screen of Google Data Studio:
In the below video, get some idea about the landing page and the next steps.
Data Source Connectivity:
The below video is about to do some hands-on experience with Google Data Studio and its Data Source Connectivity.
Difference Between Create Report vs. Explore:
•Unlike Reports, everything created in the Explorer is temporary in nature.
•The Explorer simply acts as a place for brainstorming and testing, allowing users to dive into the data before having to worry about report formatting.
- If users wish to retain the work, they will need to manually save the Explorer sheet. If we wish to share our work with others, we can export our explorations to a Report.
“Create Report” Layout Explanation:
The below video is about to do some hands-on experience with the “Create Report” layout
Create a Sample Report:
Here is some practical example of Sample Report Creation.
Report Sharing Options:
There are different options to share the report. Let’s learn from the below video.
Conclusion:
Now we have some ideas about Google Data Studio. In the future, we will explore more features of Google Data Studio.
